mirror of
https://github.com/calmh/cube-eds-grapher.git
synced 2026-07-17 01:15:05 +00:00
[UNMAINTAINED] Graph environmental data from Cube
- JavaScript 82.4%
- HTML 8.2%
- Less 6.5%
- Makefile 2.9%
| Filename | Latest commit message | Latest commit date |
|---|---|---|
| public | ||
| src | ||
| .gitignore | ||
| LICENSE | ||
| Makefile | ||
| package.json | ||
| README.md | ||
| screenshot.png | ||


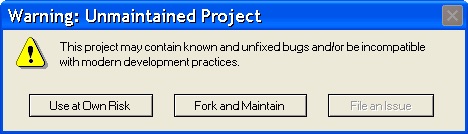
This project is not actively maintained
Issues and pull requests on this repository may not be acted on in a timely manner, or at all. You are of course welcome to use it anyway. You are even more welcome to fork it and maintain the results.
cube-eds-grapher
Graphs environmental data (temperature and power consumption) as extracted from a Cube instance. It is expected that Cube is populated with data by cube-eds-poller or something with a compatible schema.
Screenshot & Demo
A live demo (my home installation) is available for public consumption.

Installation
- Clone, run
make. You'll need to havenodeandnpmavailable. - Edit
public/config.jsonto point at your Cube installation. - Let your favorite web server serve the files from the
publicdirectory.
License
MIT